Algemene validatie
- Bij
annotationsEnabled=truemoet minstens 1 annotatie bestaan. - Elke annotatie heeft een unieke
keynodig. - Lege of dubbele keys blokkeren save.
Chart widget reference
De huidige visuele editor gebruikt native series.label, markLine, markPoint en markArea. Berekeningen over zichtbare data en center totals staan apart onder Dashview-gedrag. De Chart.js/plugin-veldnamen hieronder zijn een naslag voor oudere opgeslagen configuraties; gebruik voor nieuwe styling de native ECharts-editor.
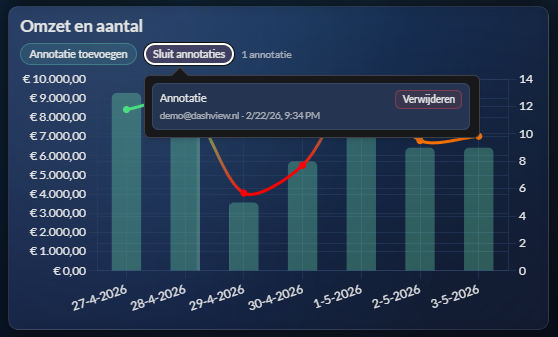
Deze pagina beschrijft de geavanceerde chartdelen: annotation schema, datalabel plugin-opties, click-interacties, sankey instellingen en native ECharts-opslag.
| Key | Waarden | Beschrijving |
|---|---|---|
dataLabelsEnabled | boolean | Master toggle. |
dataLabelsDisplay | string | Toegestane waarden: auto, true. auto of altijd tonen. |
dataLabelsScope | string | Toegestane waarden: all, first, selected. Toepassing op datasets. |
dataLabelsDatasets | string[] | Alleen bij scope=selected. |
dataLabelsComparisonOnly | boolean | Render labels alleen in comparison context. |
dataLabelsColor, dataLabelsBackgroundColor, dataLabelsBorderColor | string | Kleuren van labelbox. |
dataLabelsBorderWidth, dataLabelsBorderRadius | number | Randopties labelbox. |
dataLabelsAnchor, dataLabelsAlign | anchor/align waarden | Positie van labels t.o.v. datapunt. |
dataLabelsFontSize, dataLabelsFontBold | number/bool | Typografie instellingen. |
dataLabelsOffset, dataLabelsPrefix, dataLabelsSuffix | number/string | Offset en tekstwrappers. |
annotationsEnabled=true moet minstens 1 annotatie bestaan.key nodig.axis: x of y.valueMode: static, min, max, average, trend.static is value verplicht.lineStyle=dotted wordt als borderDash opgeslagen.labelEnabled, labelText, labelShowValue.dashviewLabelTemplate.centerSource: total of custom.custom is tekst verplicht.| Instelling | Waarden | Beschrijving |
|---|---|---|
pointClickEnabled | boolean | Activeert set-filter actie op datapoint click. |
pointFilterKey | string | Filterkey die wordt gezet. |
pointValueSource | string | Toegestane waarden: label, dataset, value. Bron van filterwaarde bij click. |
pointNavigateEnabled | boolean | Activeert navigatieactie op datapoint click. |
pointNavigateTo | string | Doel-URL voor navigatie. |
| Key | Beschrijving |
|---|---|
sankey.fromField, sankey.toField | Bron- en doelknoopvelden. |
sankey.valueField | Flowwaardeveld. |
sankey.colorField | Optional veld voor kleurmapping. |
sankey.colorMode | gradient, from, to. |
sankey.nodePadding, sankey.nodeWidth, sankey.iterations | Layout tuning. |
sankey.usePageColors | Gebruik page-kleurenpalet. |
options.echartsOptions in de volledige widget-JSON.echartsOptions.chartOptions blijven alleen legacy compatibility input.{
"kind": "line",
"xField": "order_date",
"yField": "revenue",
"agg": "sum",
"annotations": {
"annotations": {
"target_line": {
"type": "line",
"scaleID": "y",
"value": 100000,
"borderColor": "#f97316",
"borderWidth": 2,
"label": {
"display": true,
"content": "Target",
"dashviewLabelTemplate": "Target",
"dashviewLabelShowValue": true
}
}
}
},
"pointActions": [
{ "type": "set-filter", "key": "region", "valueSource": "label" },
{ "type": "navigate", "url": "/details" }
]
}